Automated testing

TestOne(Free to use online)
GUI Automated Testing
Mobile Automation Testing
API Automation Testing
Precision testing
Enterprise Automated Test Service (BPO) Solutions
Testservice
Solutions
Security Testing Solution
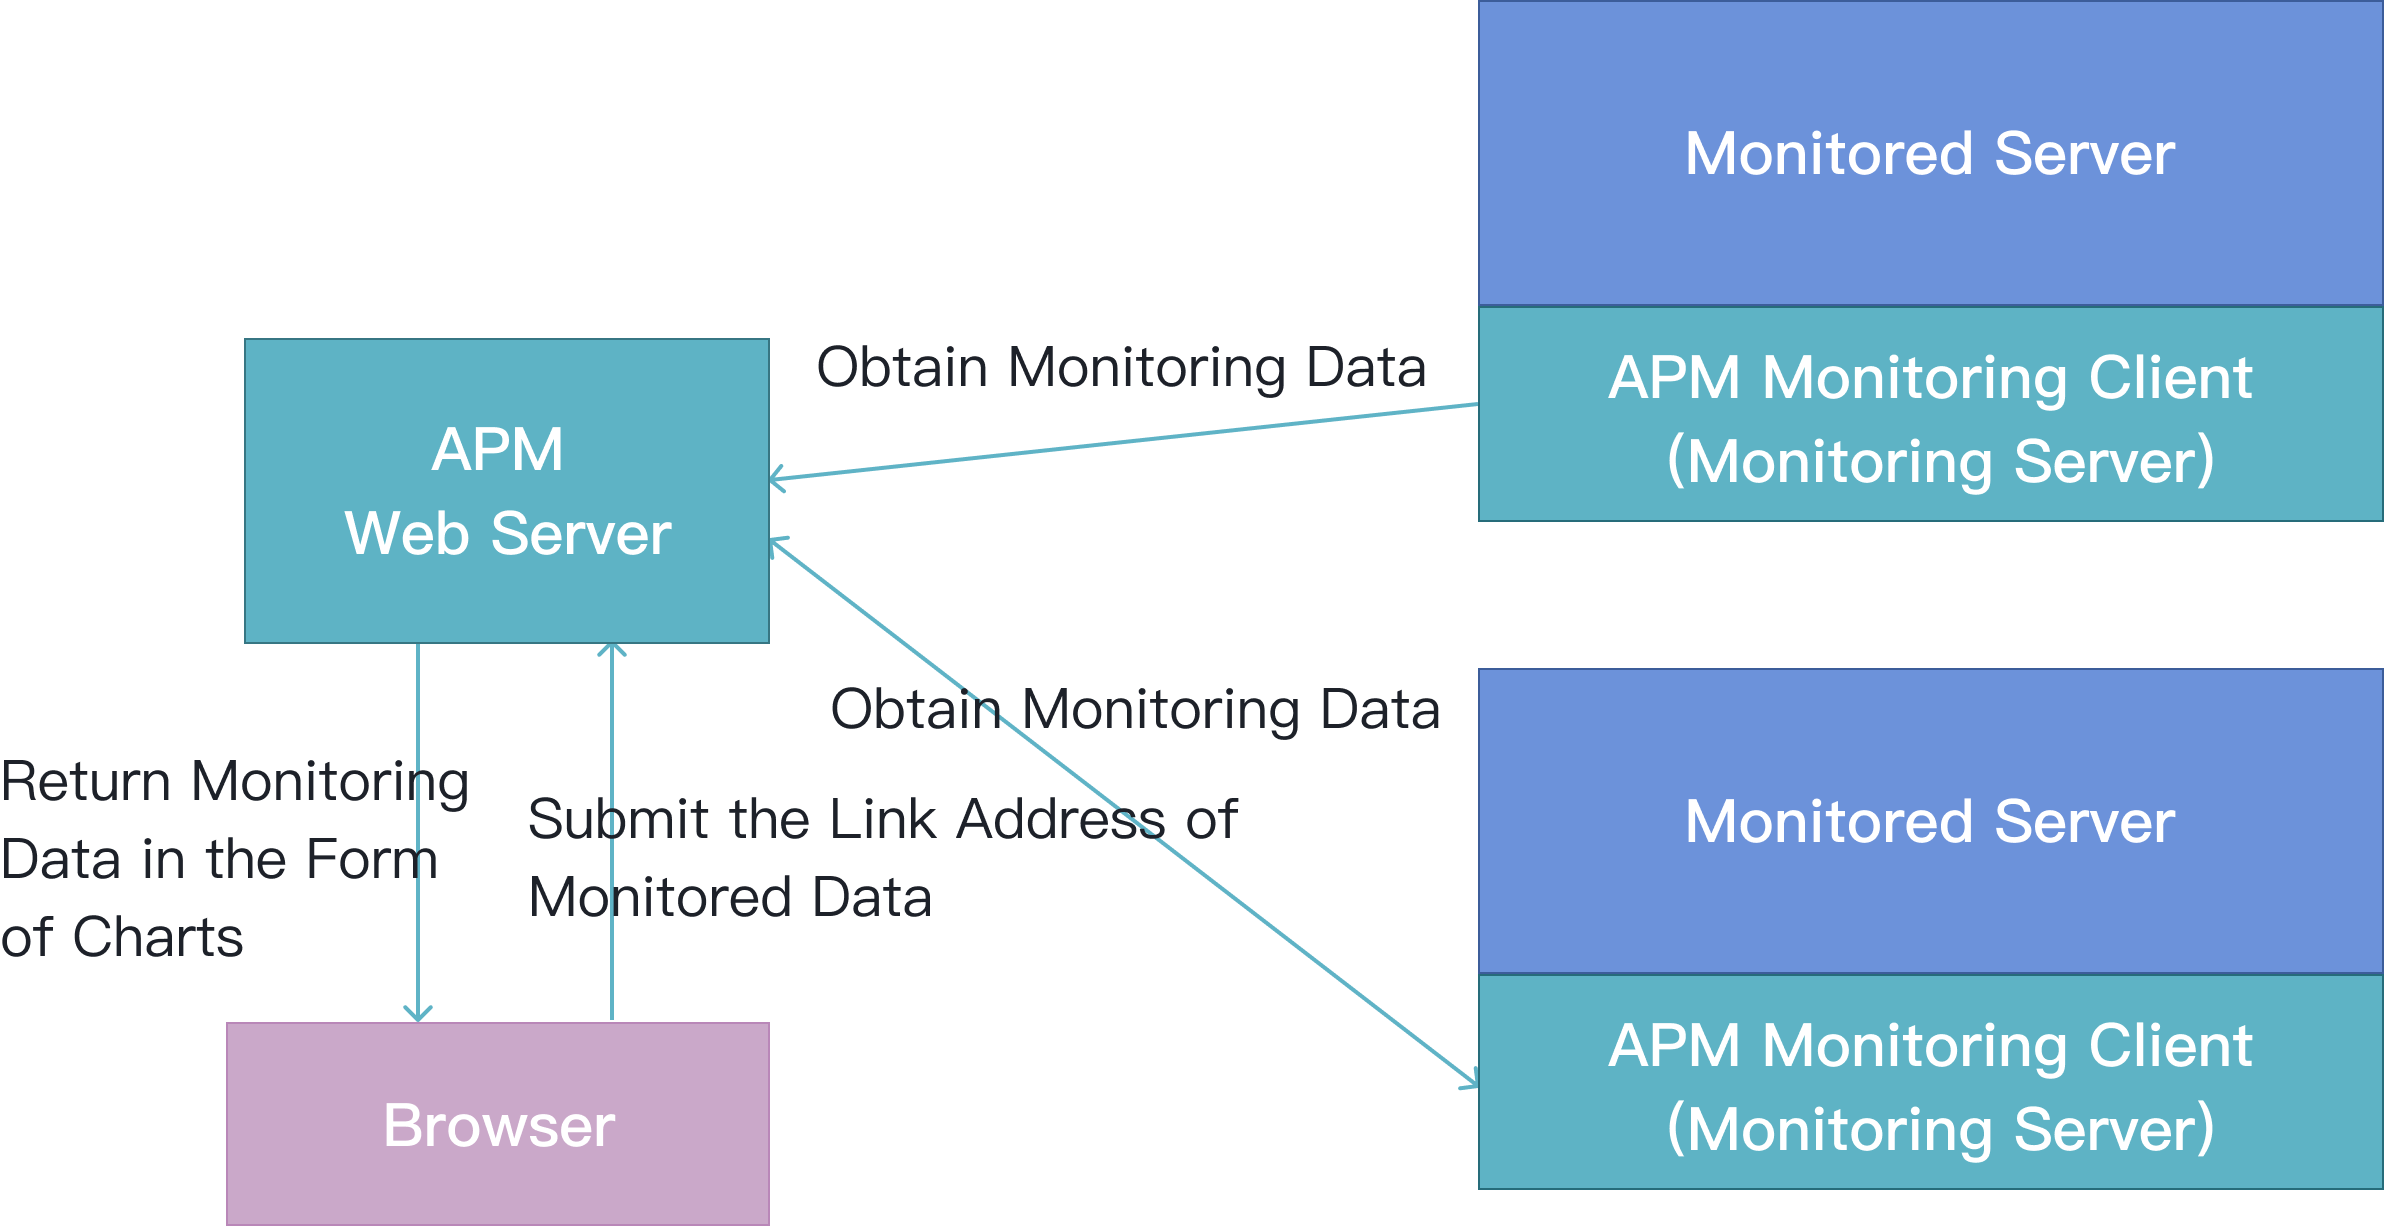
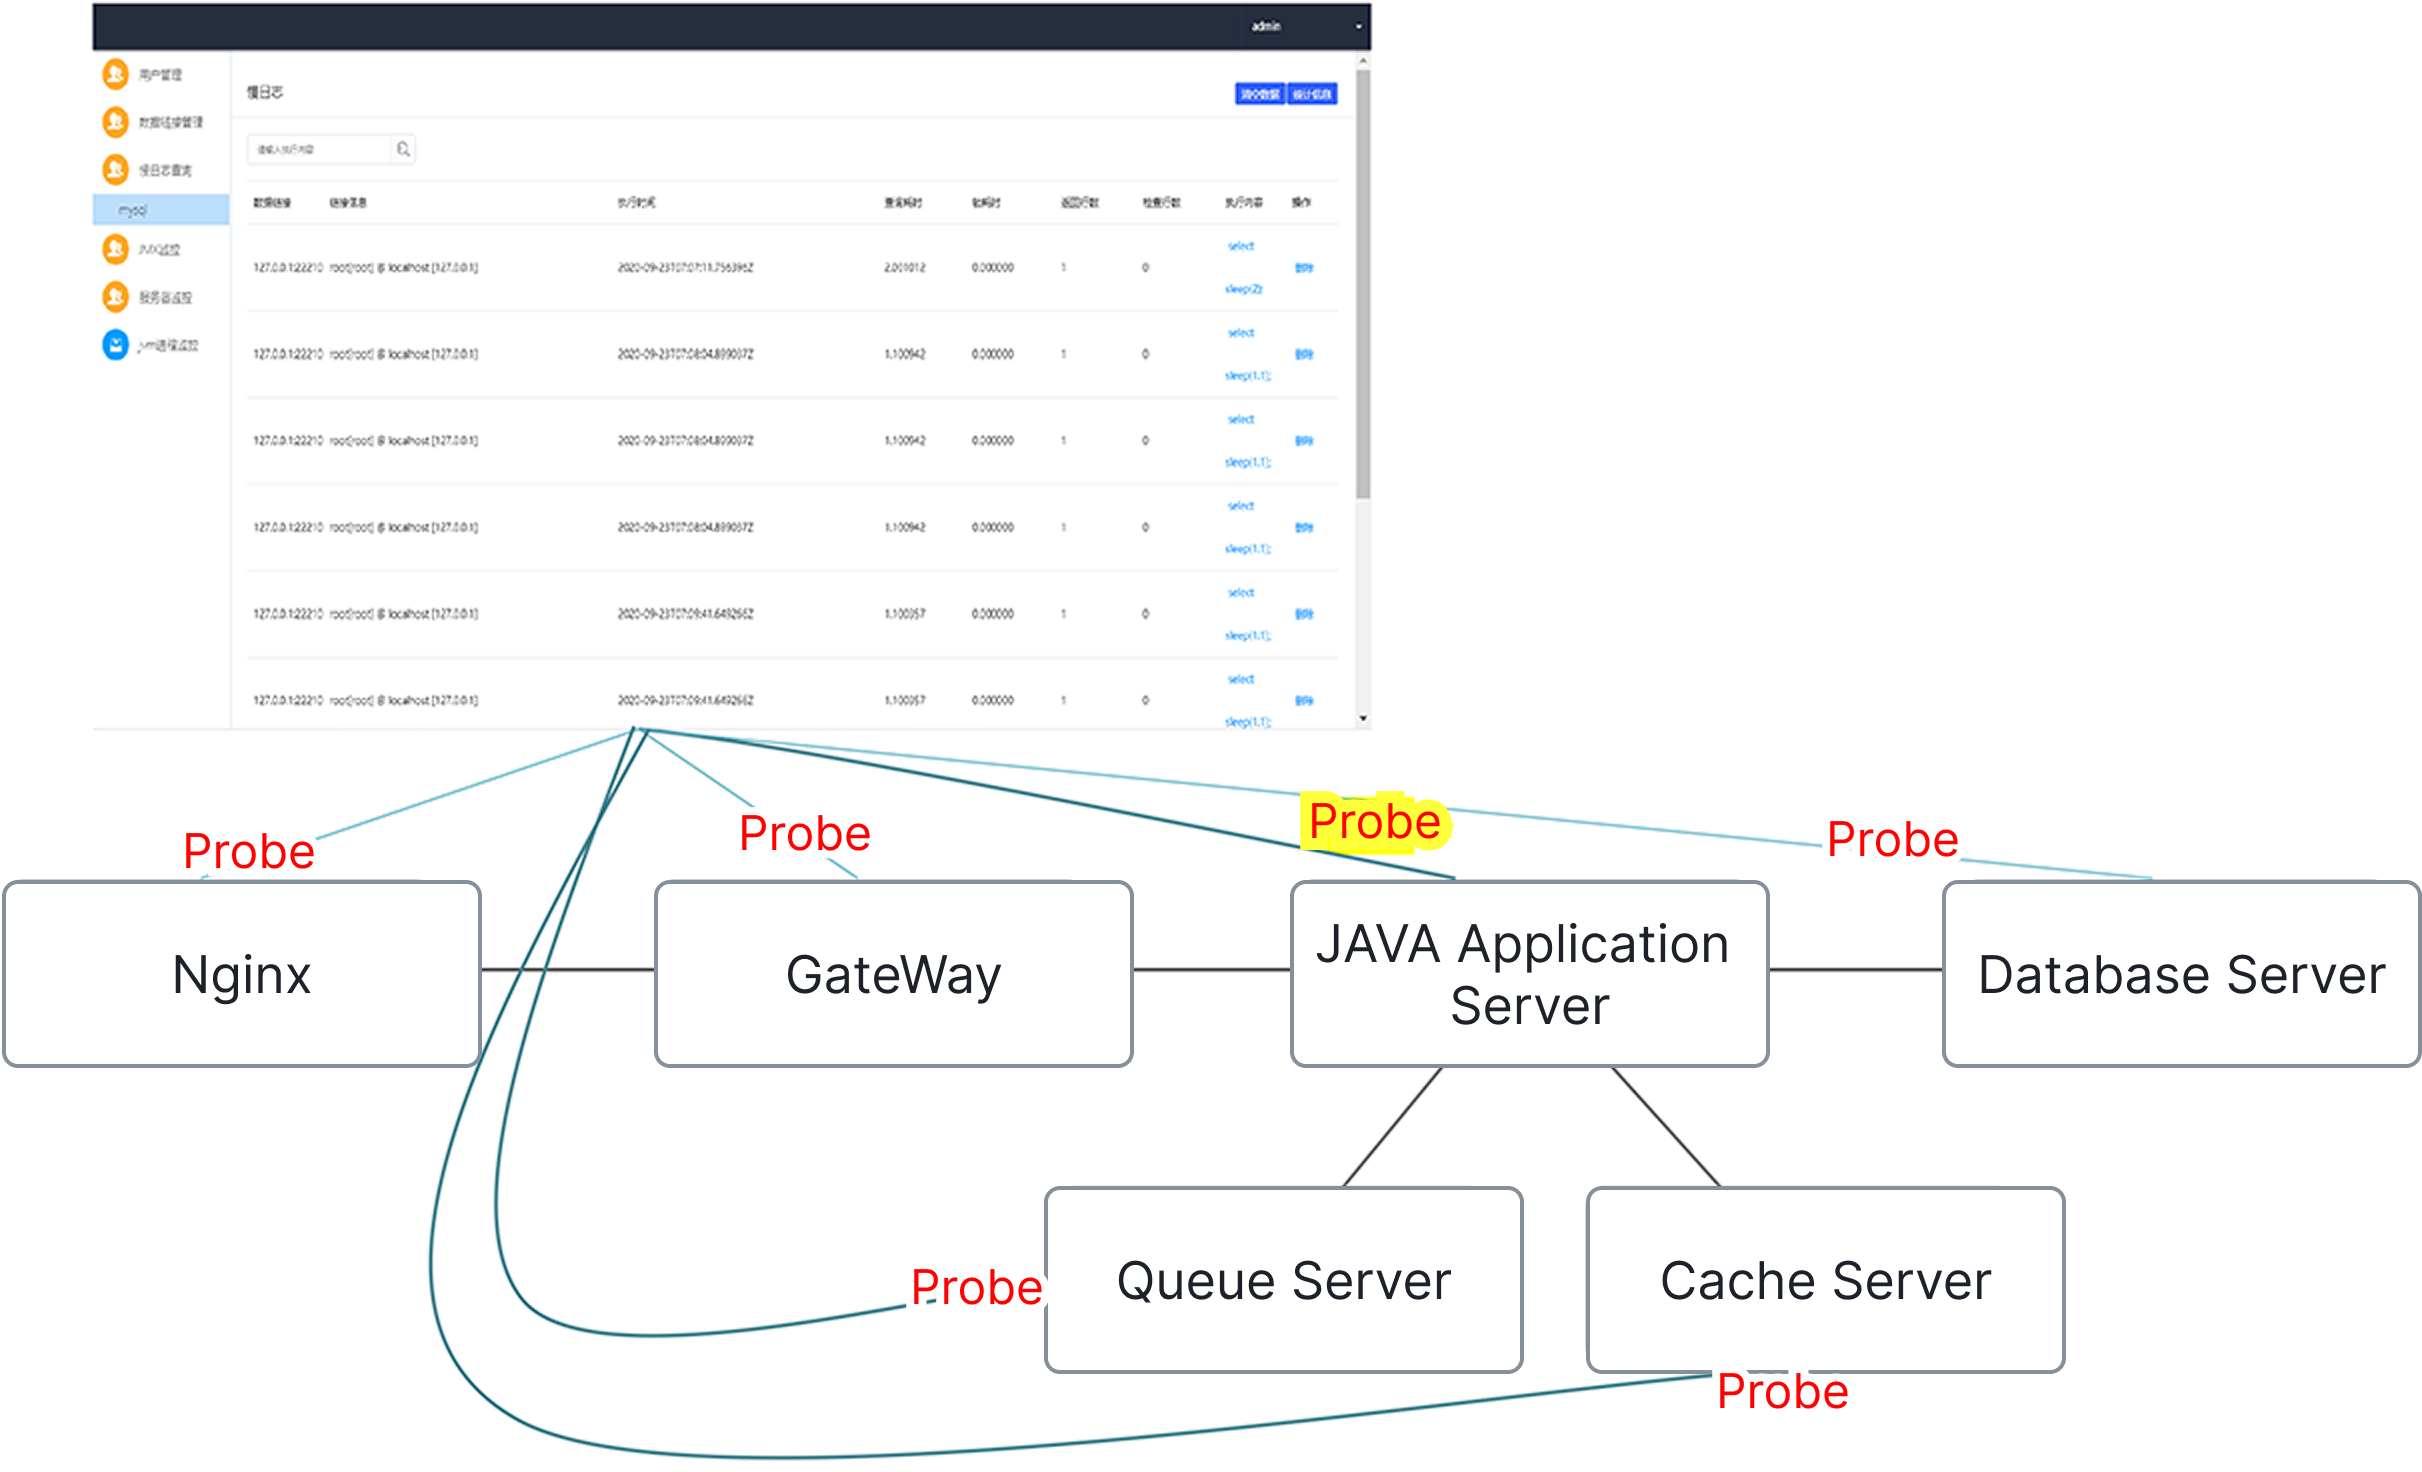
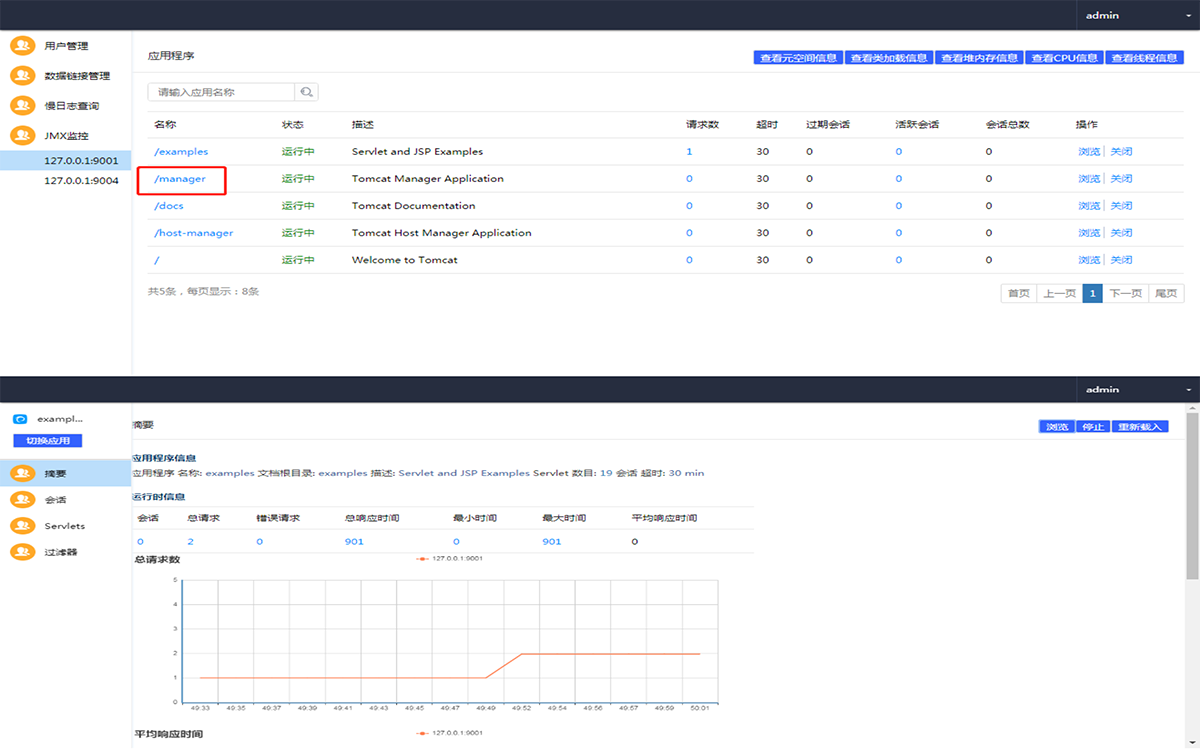
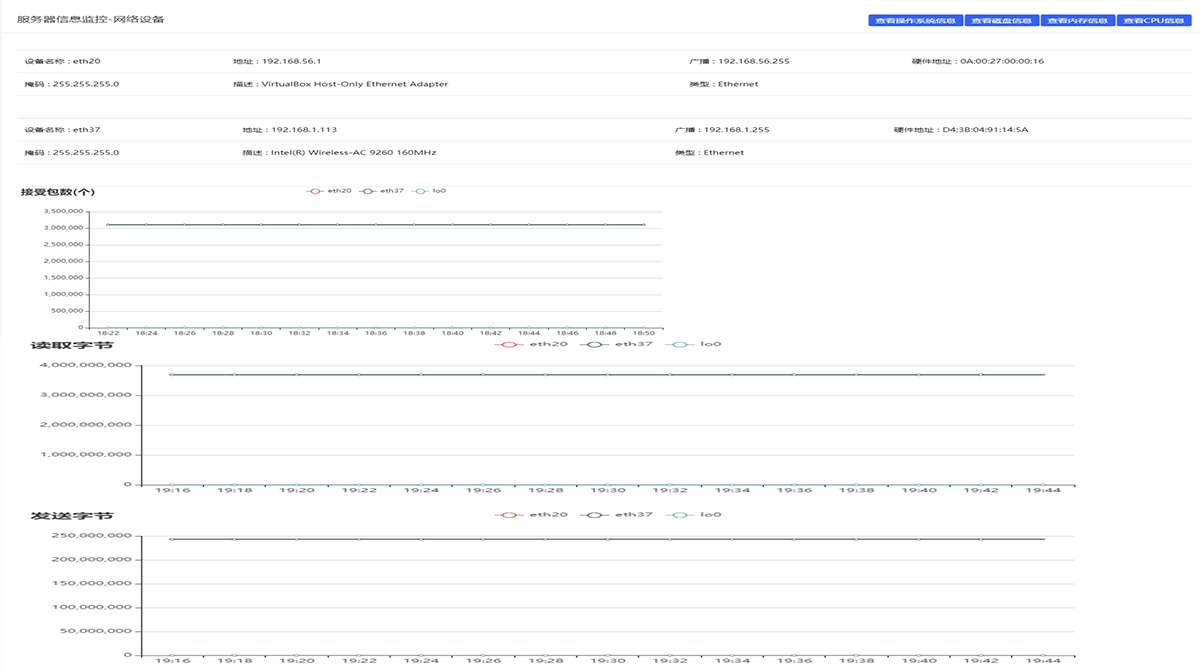
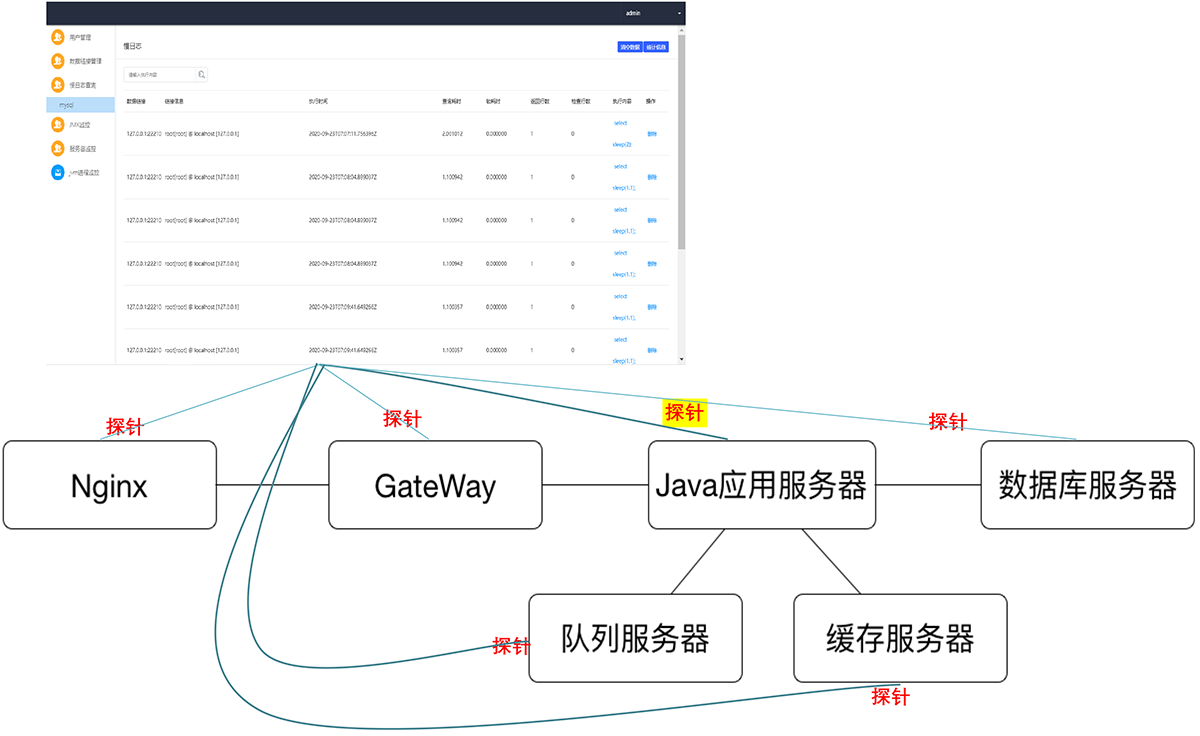
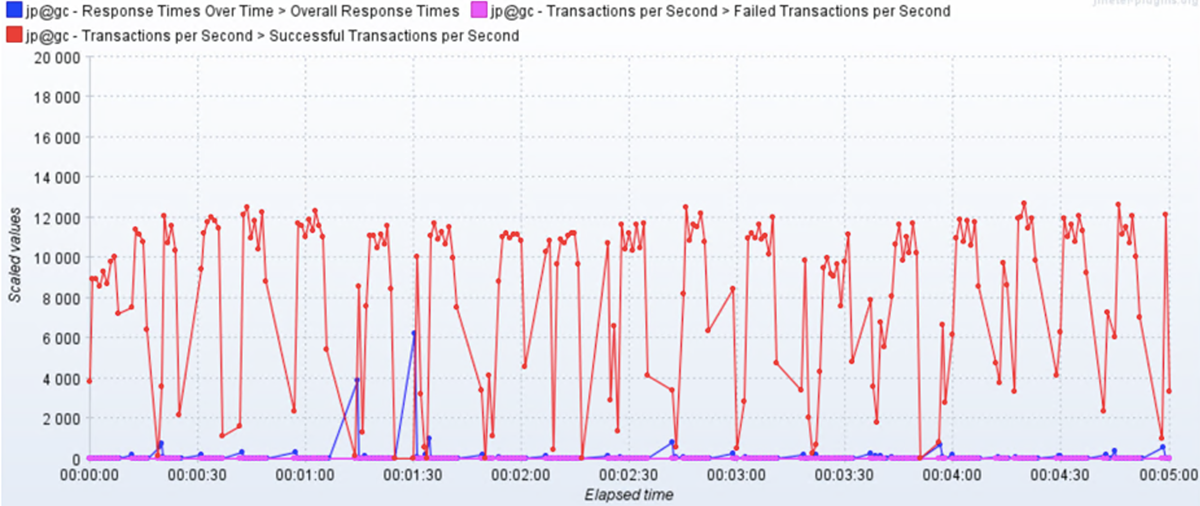
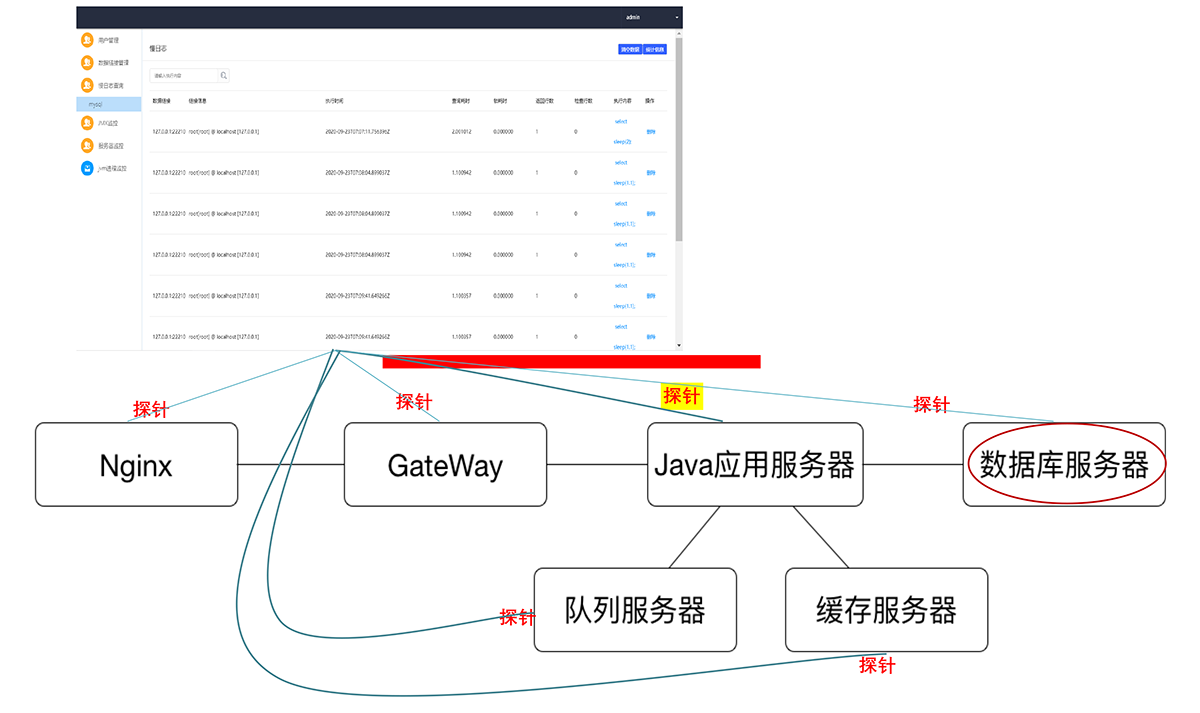
APM end-to-end load testing solution
Test Management Solution
Functional Testing Solution
Performance testing solutions
Mobile Automation Testing Solution
R&D Project Management Solution
400-035-7887

.png)